Current Earnings Trends and Charts (Q3 2015)
Day 2 Morning Breakout
SNMX

CETV

MWW

IG

SONS

Delayed Breakout
GIG

SVU

RT

Pre Announcement Short Squeeze Breakout


Post Earnings Announcement Drift
UCTT

RT

SLTD

SNMX
CETV
MWW
IG
SONS
GIG
SVU
RT
UCTT
RT
SLTD
Go here for the new earnings calendar update.
Go here for the new earnings calendar update.
This is the first step in the How to Make Money Trading Stocks With a Full Time Job series. Read the preface.
I buy earnings winners based on the chart, price action, and short interest.
I don’t invest or gamble; I capitalize on the short term price movement caused by a positive reaction to earnings. Because I don’t bother with EPS or other fundamentals taught by mainstream media and academia, It’s possible my definition of an earnings winner is different from yours. What’s an earnings winner? Here’s a great definition.
The blueprint of my strategy can be followed with three simple actions: Search for volatile stocks, find repeating patterns, then adapt to changing market conditions (more on this in step 3).
I learned my strategy from a professional short seller, and it took a lot of trial and error before I found something that was compatible with my personality. I started...
One of the keys to consistent profitability is the ability to recognize repeating patterns. Because the market trends are always changing, one must adapt, and have the conviction to pull the trigger on new, developing patterns.
One trend I have noticed recently while watching earnings winners is that they are getting stuffed on their day one breakouts, then breakout big in the morning of day 2. This pattern isn’t new, but I haven’t really seen it since last summer. Here’s a good video that explains the setup, and here are a few recent examples:


By now we’re all familiar with a stock’s ability to generate abnormal returns in the penny stock niche. If you have been following my blog or trades over the past few years, you know my earnings strategy was derived from lessons learned from Tim Sykes. I initially, and naively assumed that he had invented the idea of buying earnings winners. Although this concept has been around for decades, Sykes blazed the trail in applying the strategy to penny stocks.
Ray J. Ball & P. Brown initially introduced a study in response to the market efficiency theory, and it has been widely studied in the finance industry ever since. You can further your research here, here, and here. The consensus is, that because of reasons, stocks tend to drift upwards over an extended period of time after a positive earnings announcement.
Most of what you’ll find out there is based on fundamentals, and tends...
If you are like me, it’s always earnings season. I’m always looking for some kind of volatility to take advantage of, and it can often take weeks for a stock to cool off after a great reaction. My financial model tells me to expect a higher return during peak season, and lower returns for the slower times (obviously)… but the question is, how can one identify these time periods ahead of time, and how does your strategy ebb and flow with the seasons?
First, a look at the data:
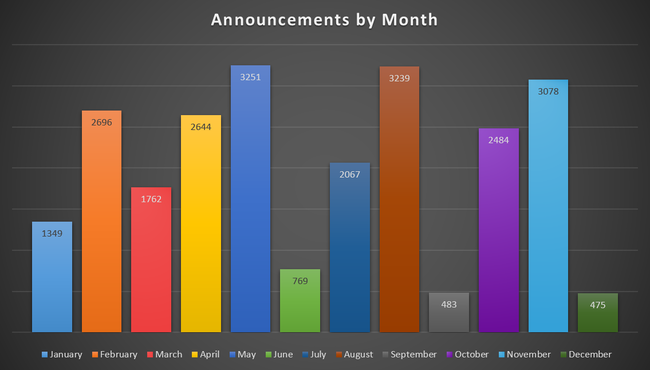
This chart tells us that each earnings season starts off slow, but quickly builds up to the mid-quarter apex, and finally cools off near the end of the 13 week cycle. Every three months we get a break, and a chance to reflect on both the new patterns that have been revealed, and how the old ones have evolved. It’s important to understand the earnings season life cycle, and conform your strategy accordingly...
I’ve read every one of Tim’s blog posts about earnings, watched every video lesson multiple times, and have watched most of his DVDs close to 10 times over. A lot of his stuff is conceptual, like “just buy on the breakout day and sell a few days later for a few dollars/share profit.” That’s helpful for defining an overall strategy, but when do you click the button to buy?
He goes over “when to buy” quite a bit, and from time to time he talks about buying an intraday breakout in anticipation of a bigger breakout above the day high. This is when I love to buy, and I like to go big because this is such a reliable setup. I’ve seen Tim use this entry strategy for years, and Nate does a great job pinpointing why and when to execute the order in his second DVD.
Most of what you need to know about this type of entry you can learn for free by watching Nate’s youtube video.
Drifters are stocks that tend to slowly creep their way up in price. Because a positive earnings reaction tends to bode well for the company on a fundamental level, these patterns are perfect for individuals who have full time jobs or don’t care to watch the market every day.
I categorize this pattern in three time frames: Short term (a steep rise in a few days), Mid term (a few weeks), and Long term (a few months). If you aren’t familiar with the post earnings announcement drift phenomenon, check out my other blog post.
The blue light bulb on the chart is ThinkorSwim’s way of signifying an earnings announcement.


This is an evolution of the Gap and Panic setup covered in quarters past. I’ve made a good deal on this trend, and the key here is patience. The general rule is to wait for the first green day to tell us the trend is changing, buy near the end of the day to minimize risk, wait some more, then take your profits. If you aren’t familiar with charts on the Thinkorswim platform, the blue light bulb icon signifies the day in which earnings were announced.


