Price action is a general term that refers to the fluctuation in stock price.. Once you identify chart patterns that consistently repeat, you can combine observations of lvl2, time/sales, and the live chart to recognize the buying and selling action that leads to the fruition of a setup.
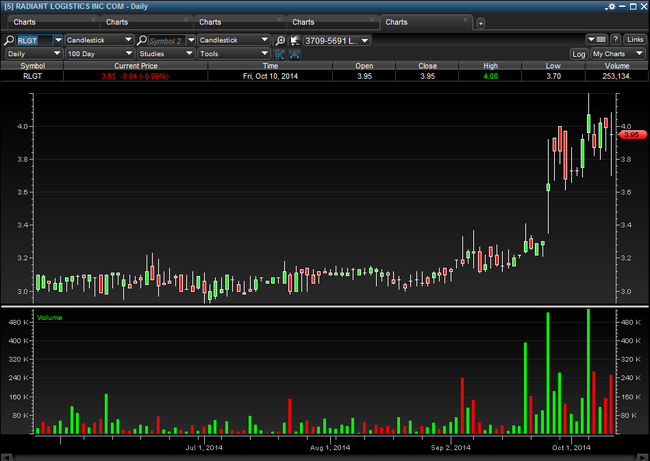
Earlier this week $RLGT’s chart began exhibiting signs of a setup in my strategy. In secondary breakouts, I look for a stock that has recently had a good reaction to earnings, and is breaking out above the high from its initial run.
For $RLGT, the high from the initial run was $4. Here’s a daily chart:

You can see on Monday the 6th, it started breaking out.. That’s when my E*Trade Pro alert went off, and I started watching the stock for specific characteristics in price fluctuation. I like these setups to exhibit the following price action:
- Lots of morning buyers (volume surge + morning spike)
- ...


