Price Action Basics
Price action is a general term that refers to the fluctuation in stock price.. Once you identify chart patterns that consistently repeat, you can combine observations of lvl2, time/sales, and the live chart to recognize the buying and selling action that leads to the fruition of a setup.
Earlier this week $RLGT’s chart began exhibiting signs of a setup in my strategy. In secondary breakouts, I look for a stock that has recently had a good reaction to earnings, and is breaking out above the high from its initial run.
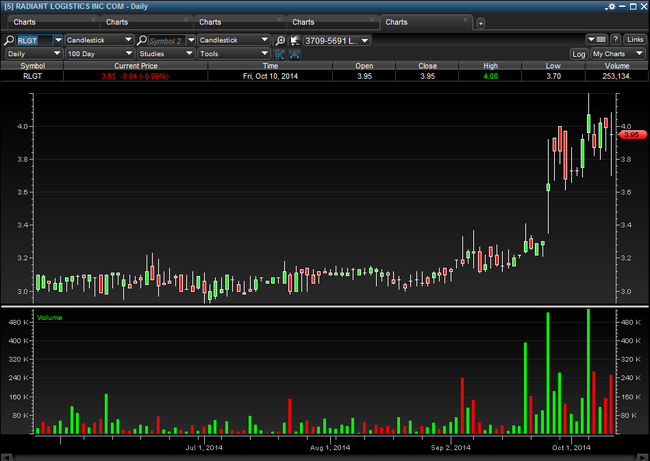
For $RLGT, the high from the initial run was $4. Here’s a daily chart:

You can see on Monday the 6th, it started breaking out.. That’s when my E*Trade Pro alert went off, and I started watching the stock for specific characteristics in price fluctuation. I like these setups to exhibit the following price action:
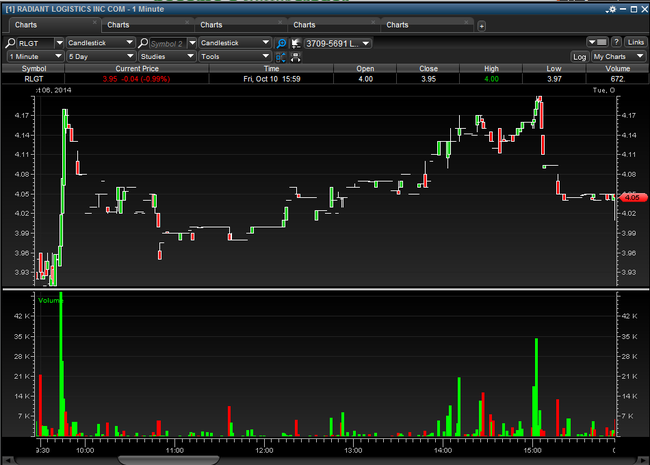
- Lots of morning buyers (volume surge + morning spike)
- Sharp pullback to the breakout level (in the case of $RLGT, back to $4)
- Healthy consolidation at the breakout level (resistance becomes support)
- Slow uptrending (signifies that the stock has digested its move, and buyers are now comfortable getting in at a higher price)
- Now we have a set risk (breakout level/$4), and I’m watching very closely as the stock price gets closer and closer to the day high.
- If the stock breaks above the day high AND holds (this is very important), I’ll add to my position.. otherwise I’ll take some off and use the set risk as my stop.
Here’s an intraday chart of $RLGT on the secondary breakout day.

The ability to interpret price action is essential in planning your entries, exits, and money management strategies. Here are a few educational videos done by the multi millionaire trader that taught me the basics of buying earnings winners: