When is Earnings Season?
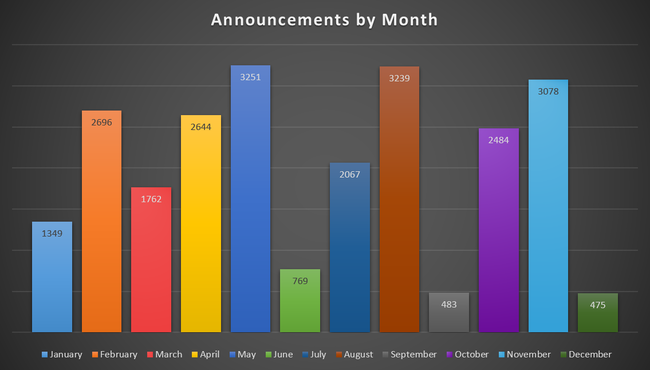
If you are like me, it’s always earnings season. I’m always looking for some kind of volatility to take advantage of, and it can often take weeks for a stock to cool off after a great reaction. My financial model tells me to expect a higher return during peak season, and lower returns for the slower times (obviously)… but the question is, how can one identify these time periods ahead of time, and how does your strategy ebb and flow with the seasons?
This chart tells us that each earnings season starts off slow, but quickly builds up to the mid-quarter apex, and finally cools off near the end of the 13 week cycle. Every three months we get a break, and a chance to reflect on both the new patterns that have been revealed, and how the old ones have evolved. It’s important to understand the earnings season life cycle, and conform your strategy accordingly. For example, during the peak of the season I tend to aggressively buy breakouts and big dips, while sticking to channel type plays during the slow times.
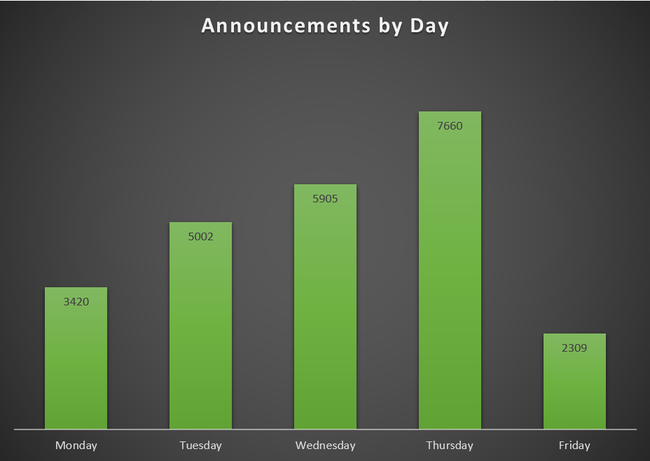
Here’s a breakdown on what days earnings announcements typically land:

